Linked data is the super-structure over which content is stretched and experiences flow. It can switch our taxonomic thinking into ontological thinking. So we can move beyond classifying content using just hierarchies and start describing the real world richness that connects our content together. Linked data can power the online journeys of the future, and turn the telescoping corridors of the web into grand cathedrals. Here’s how…
Light at the end of the tunnel
The web can occasionally feel like a series of twisty little passages. Traditionally, information architecture (IA) has grouped content into ever decreasing categories. Users navigate websites as if they were Inverted-Maslow-pyramids of hypertext needs. They descend from the general to the specific, gradually getting closer to the content they wanted in the first place. Clever linking can get you further down the rabbit hole. But essentially, lots of these websites are hierarchical and segmented silos.
Really good websites give users great linear experiences. Each page contains just enough links. Index pages reveal the groups and categories that content nodes (pages) have been organised into. Tags and taxonomies can reveal some of the other relationships that exist between these nodes. Users experience a linear journey through this content, navigating the channel created through the information architecture, interaction and interface design.
This type of IA is largely about modeling for the masses. We have to discover and consider how the majority of our audience understand the domains our websites cover. IA this way is a search for the lowest common denominator. The underlying structure of our sites is designed to cause the least amount of resistance to the largest proportion of our audience.
The channels we create through information architecture, which users navigate down, define the sequential order in which content can be accessed. This IA not only determines the spatial aspect of online experience, by defining categories and ‘sections’ to a site, but also defines the temporal aspect to experiences – as the order in which we make links available describes the paths that our products are capable of supporting. We choose what make sense to most users and provide an experience through the content that is appropriate.
User journeys are satisfying. But this ‘directed IA’ establishes a pattern where users navigate down towards content and then stay within a ‘space’. It’s as if we’re creating ladders for users to ascend and descend. They can move up and down with relative ease, but it’s fairly difficult to move any further than just a few rungs at a time. Sideways movement is even more difficult. Think about the sensation you get as you transfer your weight from a ladder. There is a moment of weightlessness where your centre of gravity feels frighteningly unsupported. Some experiences online can feel like that, as lateral leaps feel risky and require users to re-orient themselves to their position on the new prescribed, pre-planned pathway. Content is the light at the end of the tunnel, but it’s often only visible down prescribed paths.
Enter the graph
Linked data enables the emergence of a new kind of web experience. Data can describe our content nodes (pages or other formats) as well as the relationships that stand between them. It does everything we’re used to, but it’s more powerful and more flexible. It’s time for a Forrest Gump analogy.
Forrest Gump said that life is like a box of chocolates. I’m fairly certain that what he was really suggesting is that online experiences powered by linked data are like a box of chocolates.
The IA of the older World Wide Web was like one of those little cards you get in boxes of chocolates – but a special type. It not only told you the flavor of the chocolate, but it also imposed an order in which they were to be consumed. It would force you down particular paths, with the occasional limited choice – Orange cream, Caramel, [Coffee cream or Coconut whirl]. It imposed order by imposing an order – it prescribed linear paths. The web of linked data is different.
A web powered with linked data is exactly like a box of chocolates. The little map tells you the flavor and might even add additional information, for example describing categories of dark, milk and white chocolate groupings. But it doesn’t impose a linear direction to your journey of consumption. You can eat them in any order you like.
A graph-based experience doesn’t have a linear direction in the same way a hierarchical architecture imposes. Users bring the x-axis. They navigate the graph in an order of their choice – establishing their own personalised temporal/sequential element to the experience. There is still some order. Nodes are related to each other through modeled relationships. But these relationships can run across multiple axes, not just using the most widely understood categorisation. Through linked data, the categories become less important – it’s the content that counts.
Previously we might have described journeys on the web like this:

We had journeys from and between pages. But these were designed experiences based on a canonical IA representation of the mental map that the content fitted into.
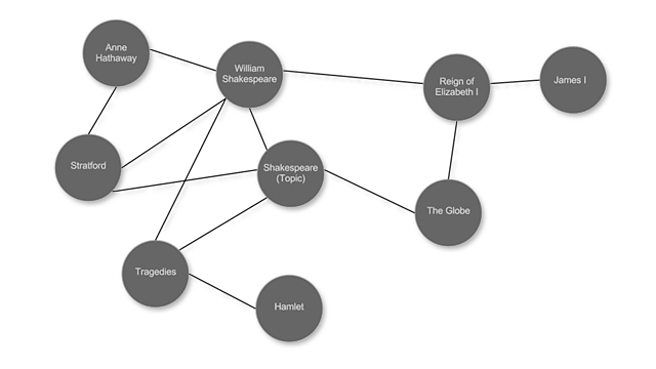
We should now be able to build journeys that have of lots of directions, more like this:

The ladders of the past can become rich, engaging climbing walls. We can still pack our content with structure, but we’re much more empowered to support multiple paths through the content.
The BBC has already had great success using Linked data to power these kinds of experiences. For the Olympics, our sport ontology described every event, athlete and venue. This allowed us to create dynamically published pages for each athlete – any story ‘about’ or ‘mentioning’ an athlete was added to their page. It also allowed us to group athletes by teams and events and gave our audience the chance to explore whatever facet they were interested in. We’re now working on ways to describe factual and learning content, using linked data to describe the people, places, events and topics that connect factual guides that will delight curious people and support even the most lateral of thinkers.
We’re also using Linked data to support the re-use of content and to ‘future-proof’ sections of our sites that are liable to change. Using our curriculum ontology we’ve described thousands of learning resources to enable school learners to find content that’s relevant to their ‘programme of study’. This allows us to surface the same guide in multiple places – wherever it’s relevant. It also means that we can adapt quickly to changes in the national curriculum. Our model is extensible, reusable and we’re sharing it – three principles at the heart of linked data.
Hard centre
Because of linked data, our audiences can use their interests to navigate, rather than the hierarchies the content fits into. It means we can use content as navigation objects. Using linked data, the structure that information architecture provides is still there. But now it’s like an invisible force, like gravity, as the user combines the hidden data with their own context. Users can build their own personal, motivated, linear path through the graph.
Linked data allows us to replace the lowest common denominator with the long tail. Whatever the interest of the user, we can provide relevant connections to related content. We no longer prioritise the majority – everyone gets a chance to choose their own adventure through our content. We can always surface the most appropriate next step.

Each content node can now become its own centre of gravity. With each step on the journey, the current bit of content becomes a hub, as spokes leading to other content rearrange themselves around the user. As the user moves, the centre of gravity follows, so that experiences don’t tend towards perfection in the way the inverted Maslow pyramid metaphor suggested, they’re always as perfect as they can be. I don’t know about you, but I think that sounds like a pretty bright future for online experiences.
This post was originally published on the BBC Academy website. But someone didn’t get the memo about Cool URIs so I’ve re-publishing here. There is a longer version of this post also on this blog.
Leave a Reply